Adventures with Windows IoT Core Kernel debugging.
Also one way of obtaining a memory dump from a Windows IoT Core device.
I'm sitting here waiting for an update to download on one of my macOS VM's in order to run a kernel debugger and take a peek at a couple of things. Unfortunately, said download is through my amazing Australian broadband:

Like trying to squeeze a steak through a straw.
So I'm spinning a Raspberry Pi around on my desk which has a fresh install of Windows IoT core and since I'm in the mood for kernel debugging decide to set that up on the RPi. Because, well, why not?
We can debug over serial by connecting an FTDI USB-to-serial board up to the Raspberry Pi's UART, and Microsoft provide documentation for setting up kernel debugging over serial on their IoT core builds: https://developer.microsoft.com/en-us/windows/iot/docs/windbg
It's pretty straightfoward to get started - Hook up ground and RX/TX, enable debugging and reboot!
Hooking up to the FTDI chip is documented very well in the Microsoft Dev Center article - You only need to connect three pins - GND, TX and RX. Admittedly the Raspberry Pi pinout is mildly convoluted, so I had to lookup a pinout diagram.
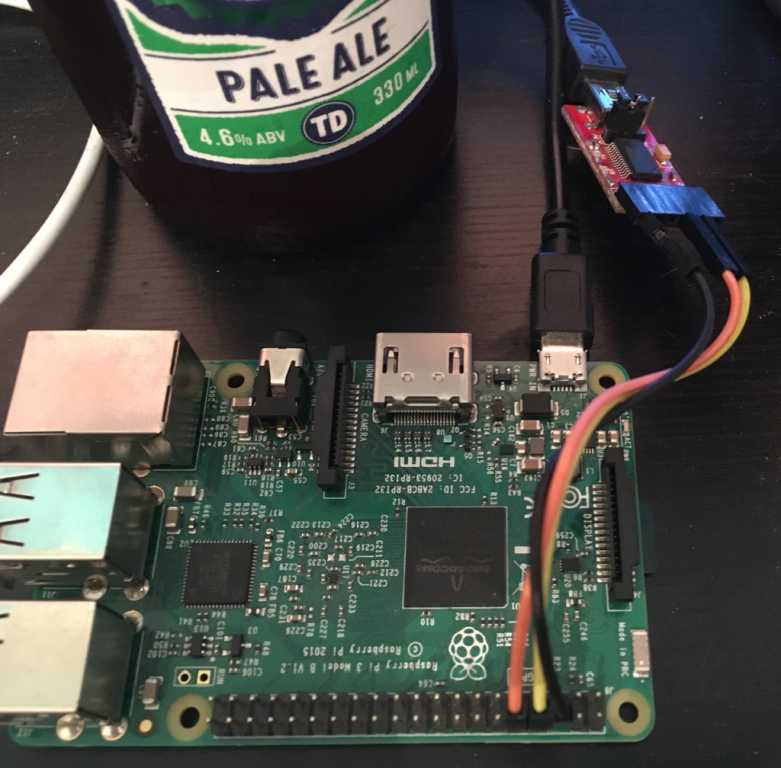
(beer also helps).
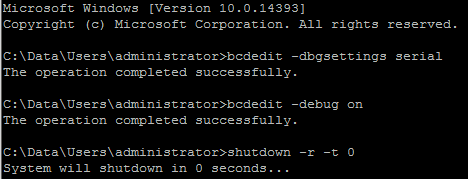
Enabling debugging is easy and documented in the aforementioned link. You can use a remote PowerShell session, or SSH in. I'm still somewhat uncomfortable with SSHing natively into a Windows machine, but it's pretty awesome.
Once the Pi has rebooted we can break into the debugger by connecting on the COM port tagged to the USB-to-Serial device and the hardcoded baud rate of 921600:
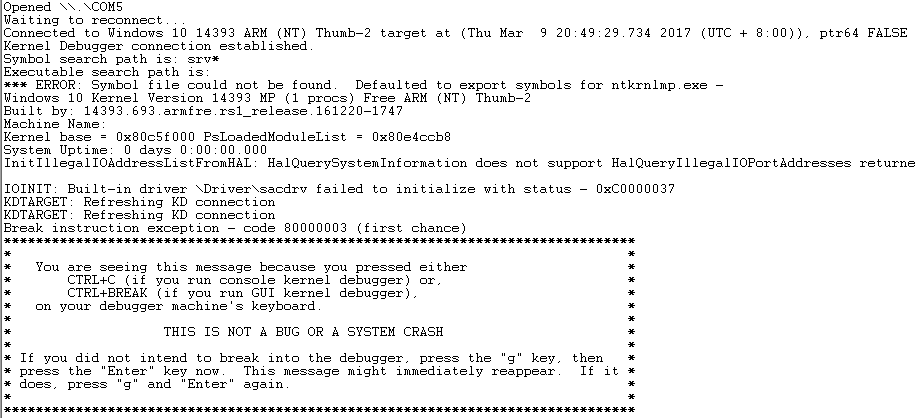
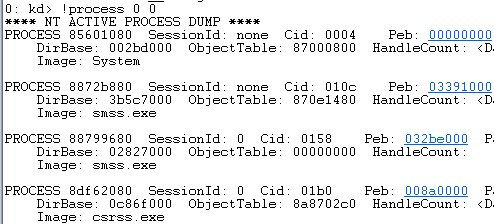
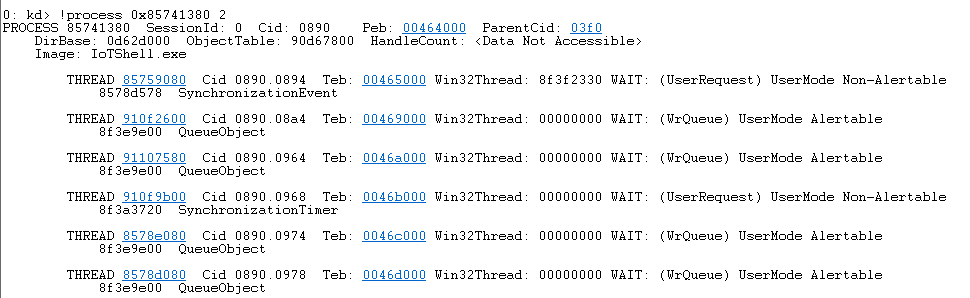
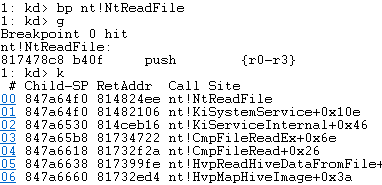
Huzzah! Now we're in the debugger we can do all of our usual Windows debuggy things, similar to if you were debugging a full-blown installation of Windows 10. We can inspect process lists, set breakpoints and step or trace through, etc:
(You could also switch to the context of a running process as well).
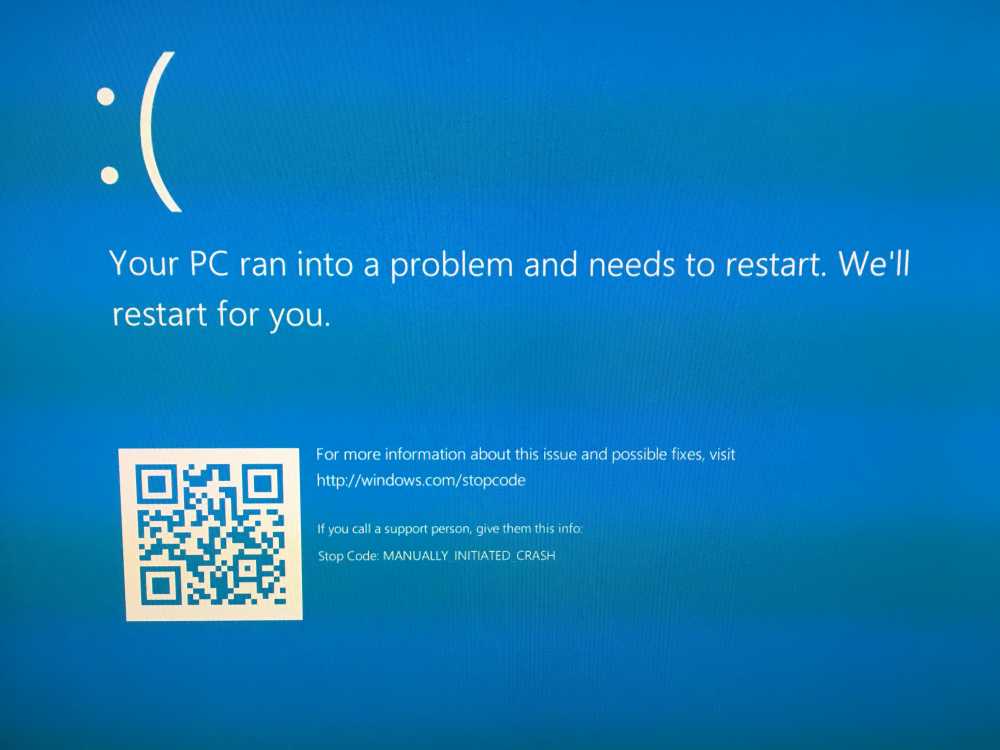
if you are feeling somewhat sadistic you can crash the system with .crash (Or more seriously - if you need to simulate a BSOD and generate a crash dump).
We can also ask windbg to generate a full memory dump for us to use in later analysis with the .dump command - Of course, transfer rates over serial could make it a bit tedious:

However, it will still probably be done before my download finishes.